Solitons in DNA
Keywords: DNA , Solitons , Sine-Gordon , Double Pendula chains , Numerical solutions of ODEs , Discrete solitons
The main goal of this research field is studying the torsional dynamics in DNA. Torsional degrees of freedom are essential for fundamental phenomena like
transcription and replication.
I was introduced to this problem by Giuseppe Gaeta and worked on it jointly with him, Mariano Cadoni and Sergio Demelio.
A first study of this problem by Yakushevich, Savin and Manevich showed that "too simple" models do not allow
solitonic-like motions for significative distances over paired chains of pendula, used to model DNA. In their model, DNA is represented by a double chain with a single
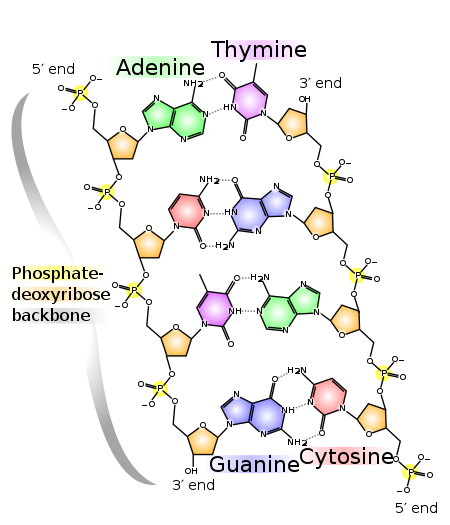
(angular) degree of freedom at each node, namely each DNA's unit of a phosphate backbone molecule and the attached base is modeled by a single disc, able to rotate about
the backbone axis. The interaction between facing bases is modeled by a harmonic potential function of the distance between the bases.
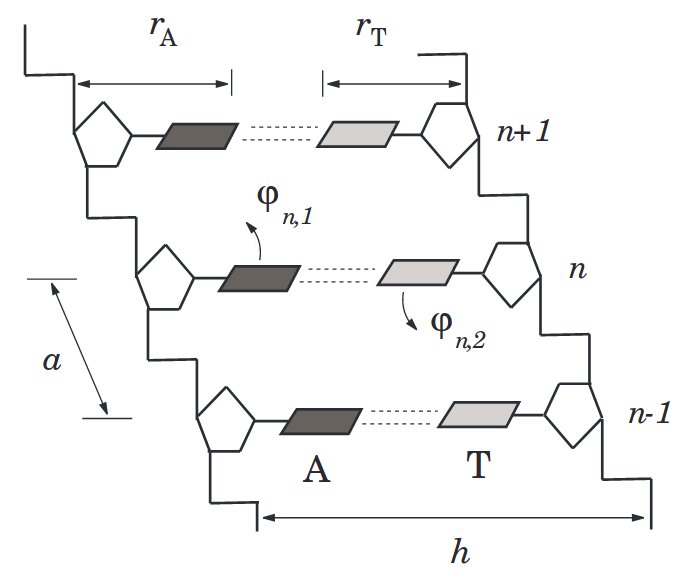
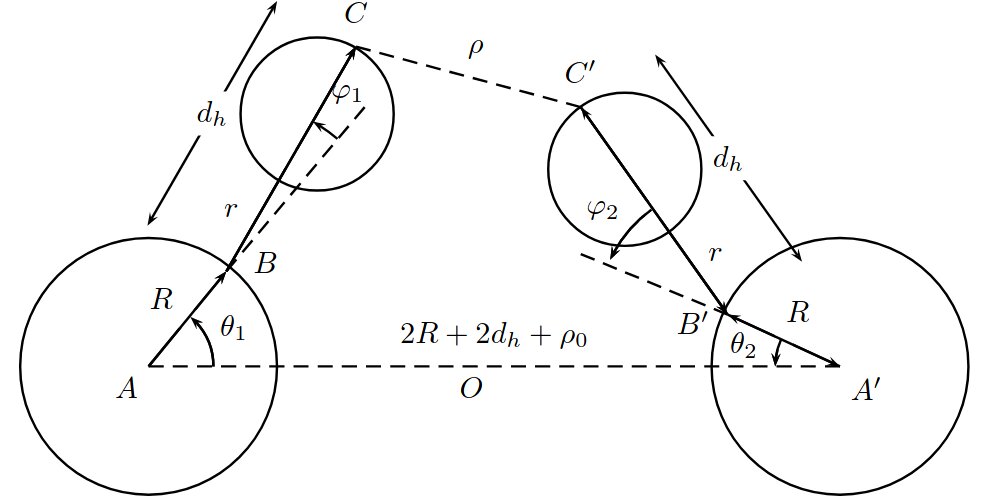
(left) The Yakushevich model. (right) Our composite model.
In a series of articles, we studied the effects of increasing the detail of the Yakushevich model after the following two improvements:
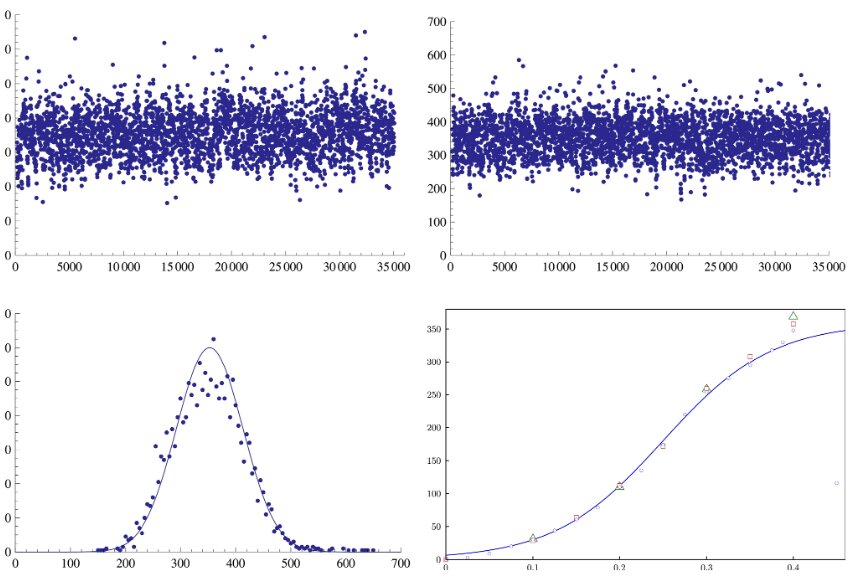 In the first row of the picture we show the distance run by soliton-like solutions, as function of the starting position, in two examples: the DNA of the human Adenovirus (left)
and a random DNA chain (right). In the second row, on the left we show the number of solutions above as function of the distance run; on the right, we show the average distance
run as function of the speed of the solution in case of the adenovirus DNA chain (blue, circles), of a random chain (red, squares) and of the human mitochondrial DNA (green, triangles).
See the articles below for more details, results and examples:
In the first row of the picture we show the distance run by soliton-like solutions, as function of the starting position, in two examples: the DNA of the human Adenovirus (left)
and a random DNA chain (right). In the second row, on the left we show the number of solutions above as function of the distance run; on the right, we show the average distance
run as function of the speed of the solution in case of the adenovirus DNA chain (blue, circles), of a random chain (red, squares) and of the human mitochondrial DNA (green, triangles).
See the articles below for more details, results and examples:
In a series of articles, we studied the effects of increasing the detail of the Yakushevich model after the following two improvements:
- (Geometrical) The backbone, unlike the ACGT bases, is homogeneous and so more suitable to allow solitonic-like motions through it. This suggested us to double the degrees of freedom by modling each node not as a single pendulum but rather as a double pendulum.
- (Dynamical) The harmonic potential increases monotonically with the distance between bases. In reality, the potential is strongly directional and goes quickly to constant as soon as the bases rotate enough that are not facing eacch other anymore. We modeled this behavior by replacing the harmonic potential with a Morse one.
- M. Cadoni, R. De Leo and G. Gaeta, A composite model for DNA torsion dynamics, Phys. Rev. E, 75, 021919 (21 pages), 2007, arXiv:q-bio/0604014v2
- M. Cadoni, R. De Leo, S. Demelio and G. Gaeta, Twist solitons in complex macromolecules: from DNA to polyethylene, Int. J. on Non-Linear Mechanics, 43, 1094-1107, 2008, arXiv:0710.4475v2
- M. Cadoni, R. De Leo and S. Demelio, Soliton propagation in homogeneous and non-homogeneous models for DNA torsion dynamics, Journal of Nonlinear Mathematical Physics, 18:S2, 287-319, 2011, manuscript
- R. De Leo and S. Demelio, Some numerical results on motion of kinks in some model of DNA torsional dynamics", CAIM, 2:1, 18 pages, 2011